Use these links to jump to sections on this page:
Data on Disability and Aging in San Francisco
Profile of Older Adults in San Francisco
Challenges Facing Older Adults
Profile of People with Disabilities in San Francisco
Challenges Facing People with Disabilities
Relevant Needs Assessments
Paratransit Rider Profiles
Data on Disability and Aging in San Francisco
San Francisco is home to an estimated 187,000 adults aged 60 and older, and 38,000 adults aged 18-64 with disabilities.[1] Together, these two groups make up about 25% of the city’s population.
Older adults and people with disabilities are essential members of the San Francisco community, benefiting from and contributing to the city's cultural, social, and enrichment opportunities. To effectively meet their needs, it is crucial to understand the social, demographic, and economic factors that impact their experiences and outcomes.
Data on these populations is also crucial to meeting the intersectional needs of San Francisco's older adults and people with disabilities. For example, two thirds of people with disabilities in San Francisco are Black, Indigenous or people of color.
Profile of Older Adults in San Francisco
Older adults are the fastest growing age group in San Francisco. Nearly 30% of residents will be aged 60 or older by 2030. According to onboard surveys prior to the pandemic, older adults in San Francisco previously comprised about 20% of Muni ridership.
Older adults live in all parts of the city in a diverse range of neighborhoods. However, the Supervisorial Districts with the greatest share of older adults in the city are Districts 4 and 7. This includes the neighborhoods of Inner Sunset, Sunset/Parkside, Lakeshore and areas west of Twin Peaks. Districts 1, 3 and 11 also have a large population of older adults.
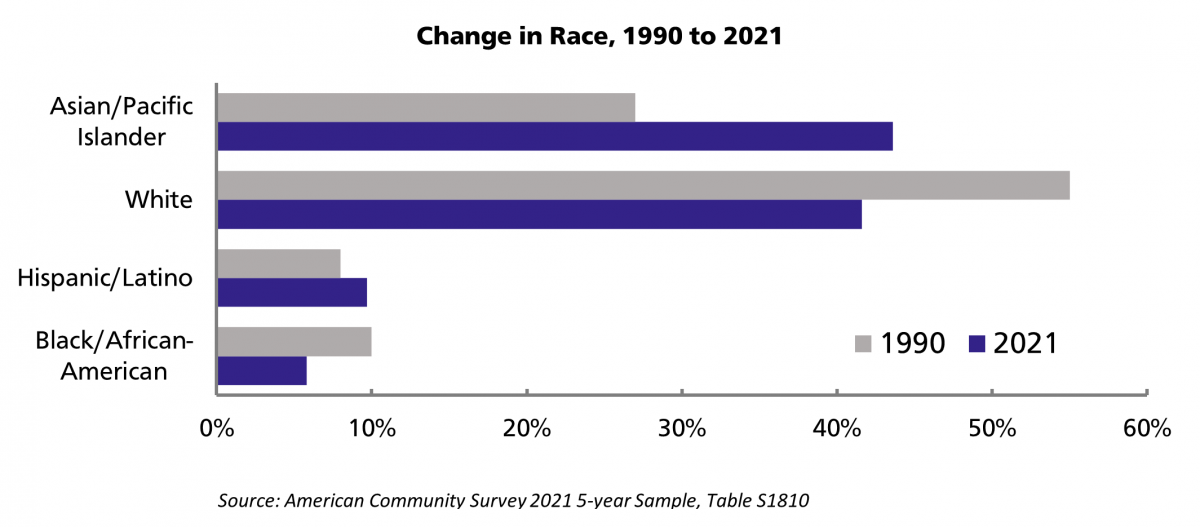
San Francisco is home to one of the nation’s most diverse populations of older adults. Ten percent of San Francisco older adults self-identify as LGBTQ+[2] and over the past three decades, the community of older adults has shifted to become predominantly a population of immigrants.[3] Fifty-two percent of older adults in San Francisco speak a primary language other than English.[4] However, while San Francisco’s older adult population has grown, the Black population, including older adults, has declined and is the only racial group in San Francisco to consistently decline in every census count since 1970.
In San Francisco, older adults use a variety of transportation modes to access appointments, go shopping, visit friends and family and go to work. About 24% of working adults over the age of 60 take public transportation to their workplace. Nearly 10% walk to work.[5]
Figure 1. Percentage of San Francisco residents that are aged 60 or older
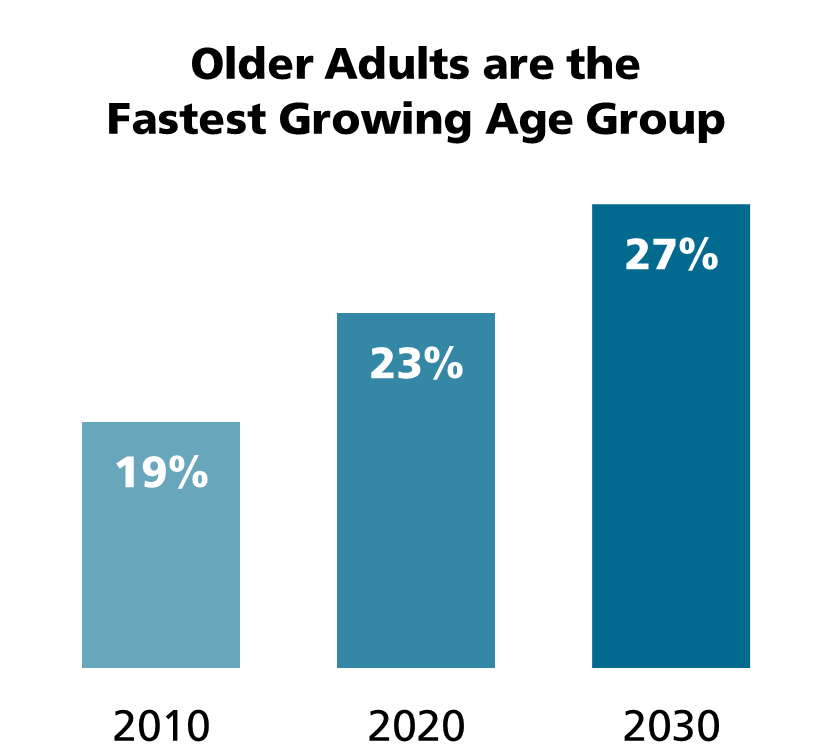
Figure 2. Percentage of Seniors (60 years or older) by Supervisor District 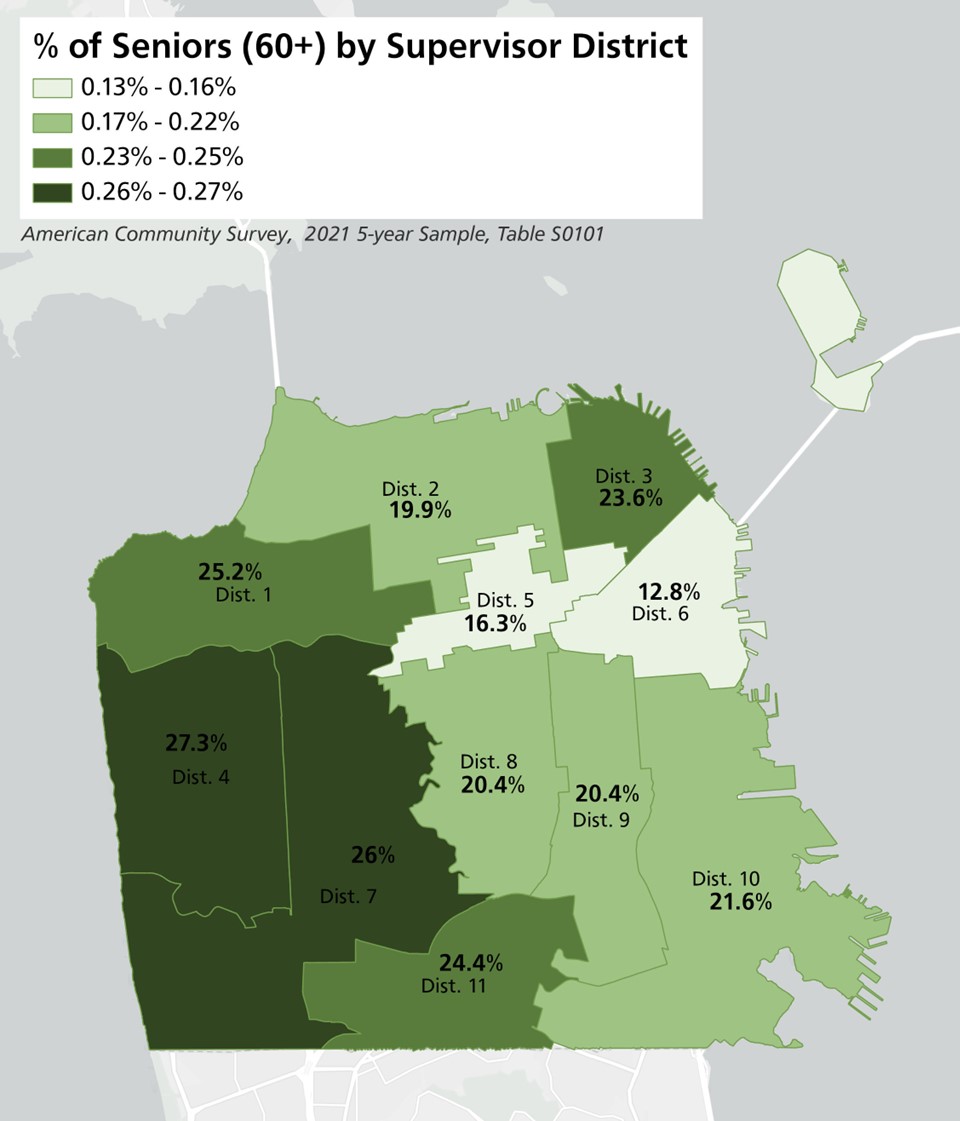
Figure 3. Percentage of Seniors (60 years or older) by Census Tract
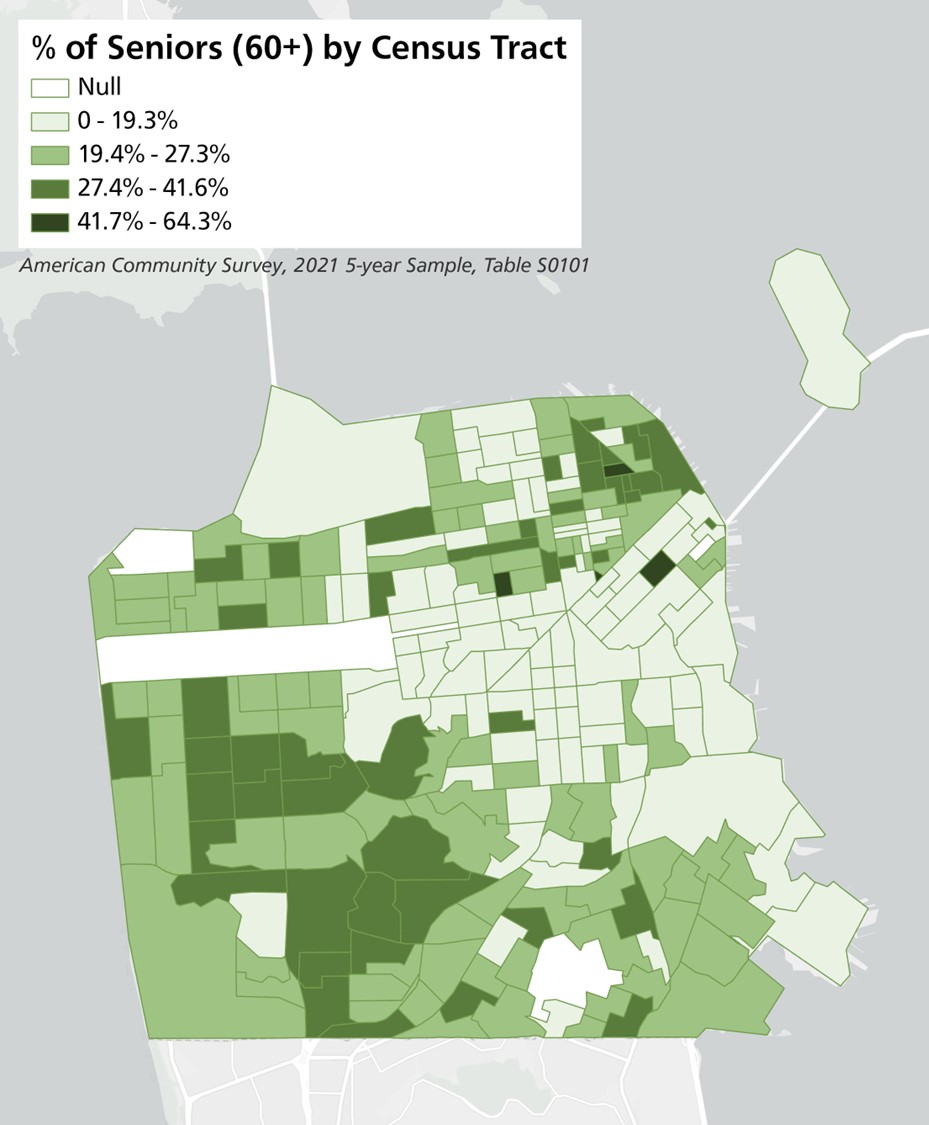
Figure 4. Change in Race of Older Adults (60 years or older), 1990 to 2021
Challenges Facing Older Adults
As older adults continue to age, transportation barriers become more prominent and can be exacerbated by other challenges. For example, it costs $45,000-$50,000 per year to meet basic needs in San Francisco, depending on whether someone is a renter or a homeowner. The average Social Security benefits are $17,220 per year[6] and 13% of older adults in San Francisco are living below the federal poverty line ($14,580).[7]
Many older adults in the city live on a limited fixed income while facing higher housing costs and rising costs for other necessities like food, transportation and healthcare. They are more likely to live alone than older adults in other urban communities throughout California, with nearly 28% of older adults in San Francisco living by themselves.
Without support and well-planned accessible transportation options to meet older adults needs, these financial limitations — combined with a natural reduction in mobility, and lessening ability to independently use public transit or drive themselves — can greatly diminish quality of life.
Profile of People with Disabilities in San Francisco
One in ten San Francisco residents reports a disability - from mobility, cognitive and sensory disabilities to difficulty with independent living and personal care. Over 42% of adults with disabilities report having two or more types of disability.[8]
While disability is commonly associated with aging, almost half of people with disabilities in San Francisco are under the age of 65. Another common misperception is that the public transit system is not used by people with disabilities. However, 22% of people with disabilities report that they ride public transportation daily.[9]
Adults with disabilities (aged 18-64) live throughout the city, but the population is most highly concentrated in Supervisorial Districts 3 and 5, which includes the neighborhoods of North Beach, Russian Hill, Nob Hill, Chinatown, Tenderloin, Western Addition, Hayes Valley and Japantown. Treasure Island also has a high proportion of residents with a disability, though this is not statistically significant.
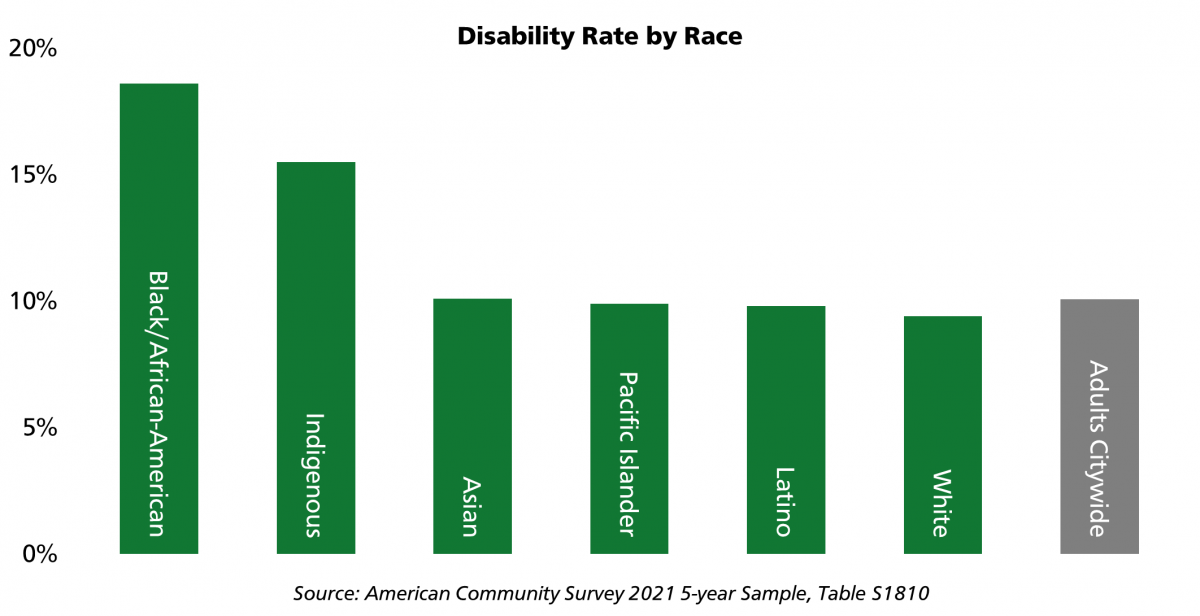
In San Francisco, ten percent of adults have a disability, and approximately 66% of disabled people are Black, Indigenous and people of color. Black residents are twice as likely to experience disability as most other ethnic groups in the city. Indigenous residents are also 5% more likely to experience disability compared to the average San Francisco resident.
Figure 5. Disability by Type in San Francisco
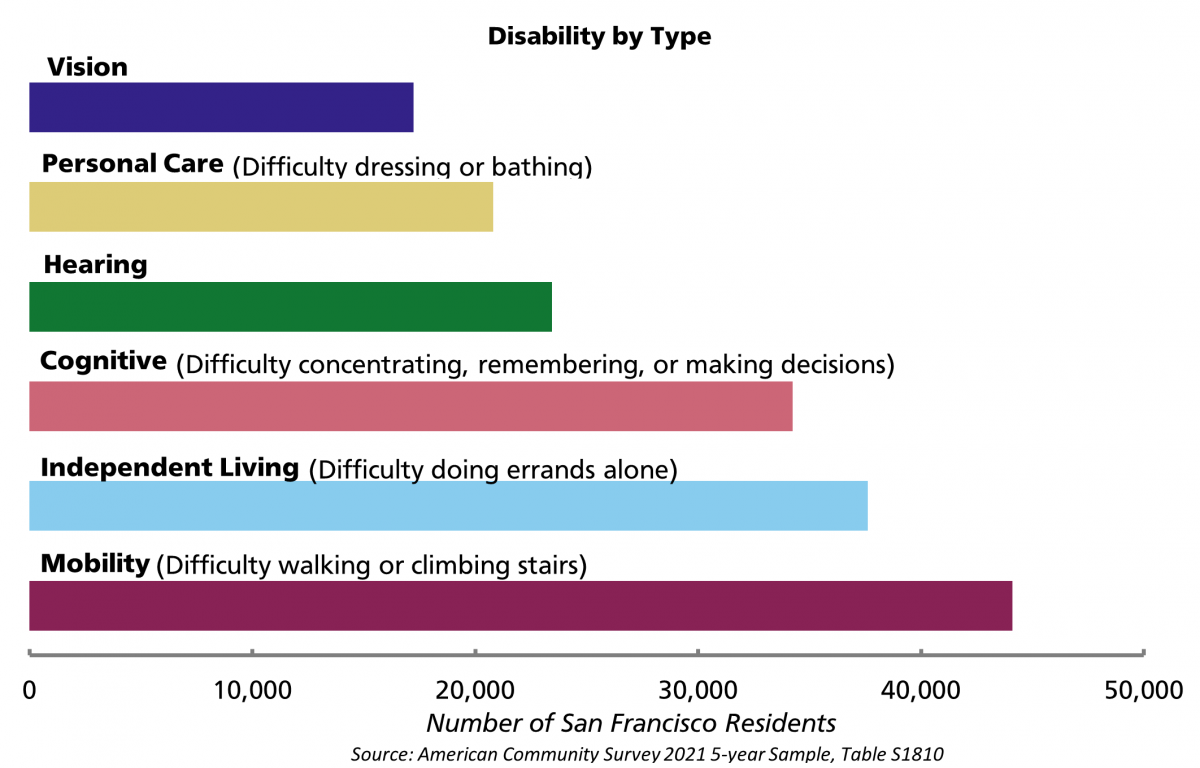
Figure 6. Disability Distribution by Age
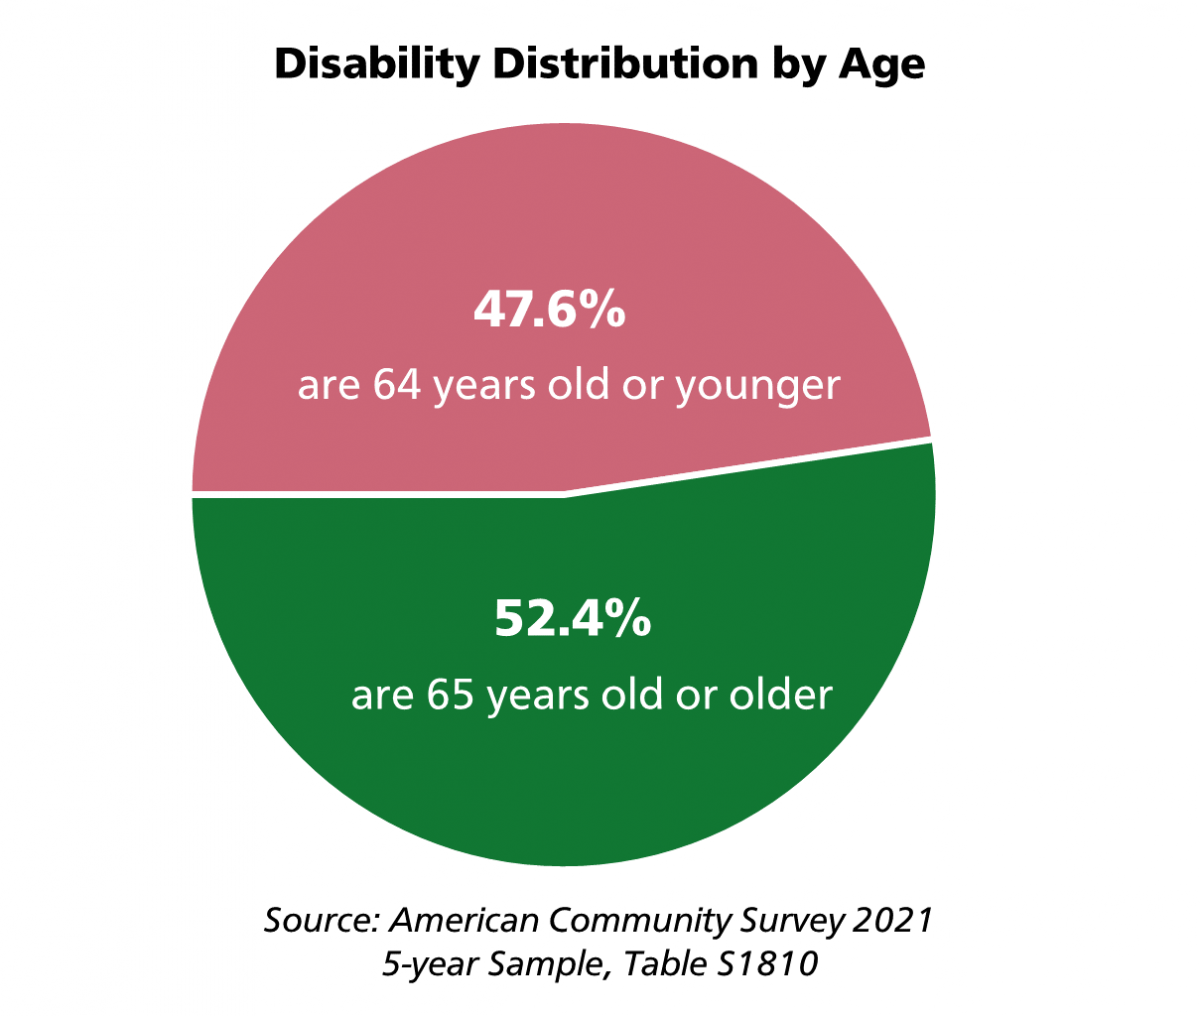
Figure 7. Population Aged 18-64 with a Disability, by Supervisor District

Figure 8. Population Aged 18-64 with a Disability, by Census Tract
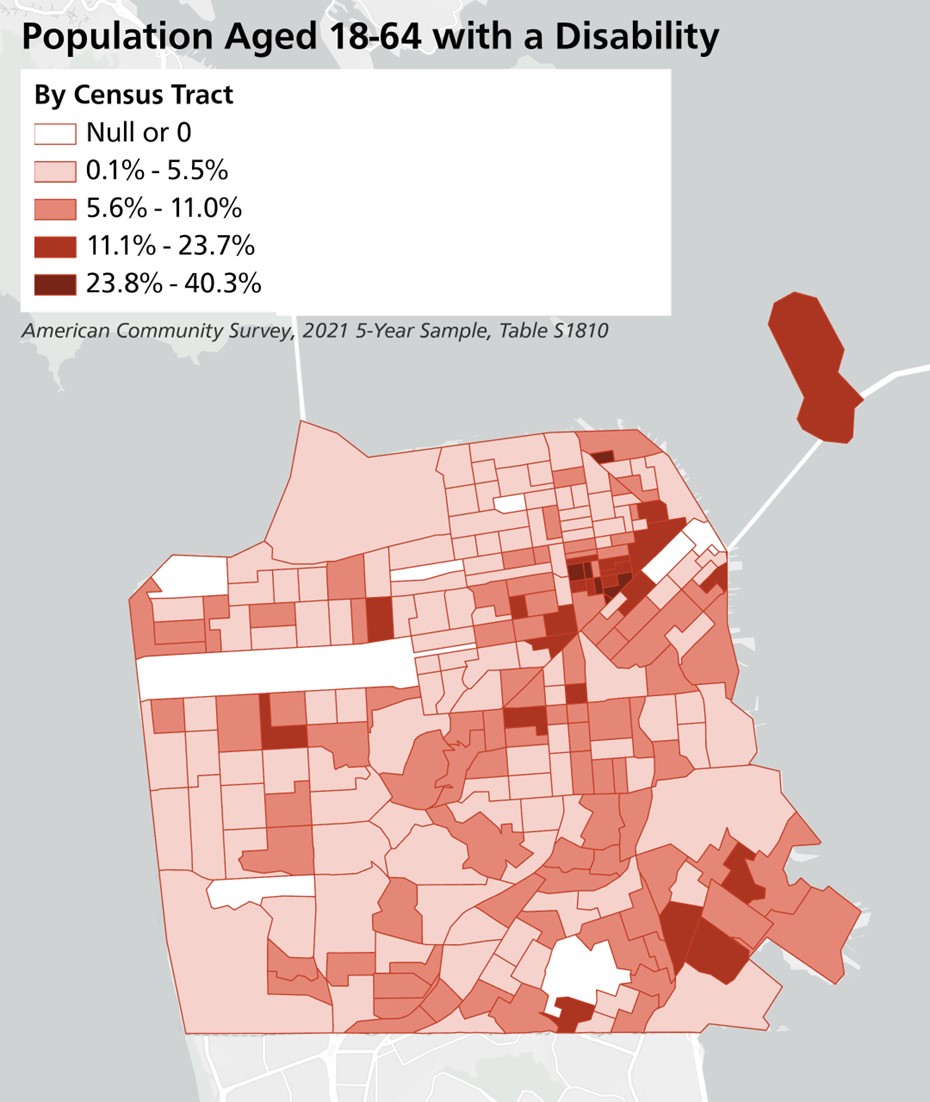
Figure 9. Disability Rate by Race
Challenges Facing People with Disabilities
Disabled people in San Francisco face a variety of income-related barriers. One in 10 unemployed individuals have a disability.[10] One in four people with disabilities live in poverty, and even disabled adults who are employed are more than twice as likely to experience poverty.[11] Almost 7% of people with disabilities do not have health insurance coverage.[12]
For people with disabilities, a variety of barriers can lead to limited transportation options, which reduces the ability to maintain employment or a social life. Barriers include deteriorating street infrastructure — more than 40% of people with disabilities rate the condition of the city’s street pavement, sidewalk pavement and curb ramps in their neighborhood as “poor.”[13] Half of two people with disabilities feel unsafe walking alone at night in their neighborhood.[14] Additionally, San Francisco’s hilly geography can be strenuous to navigate for those with limited mobility. Transit riders with disabilities face many challenges when accessing the transit station, boarding the vehicle, and riding in the vehicle.
Additionally, 21% of San Francisco residents with disabilities live in a household that does not have access to a car, more than five times the proportion of non-disabled residents.[15]
Figure 10. Household Access to Vehicles for People with Disabilities
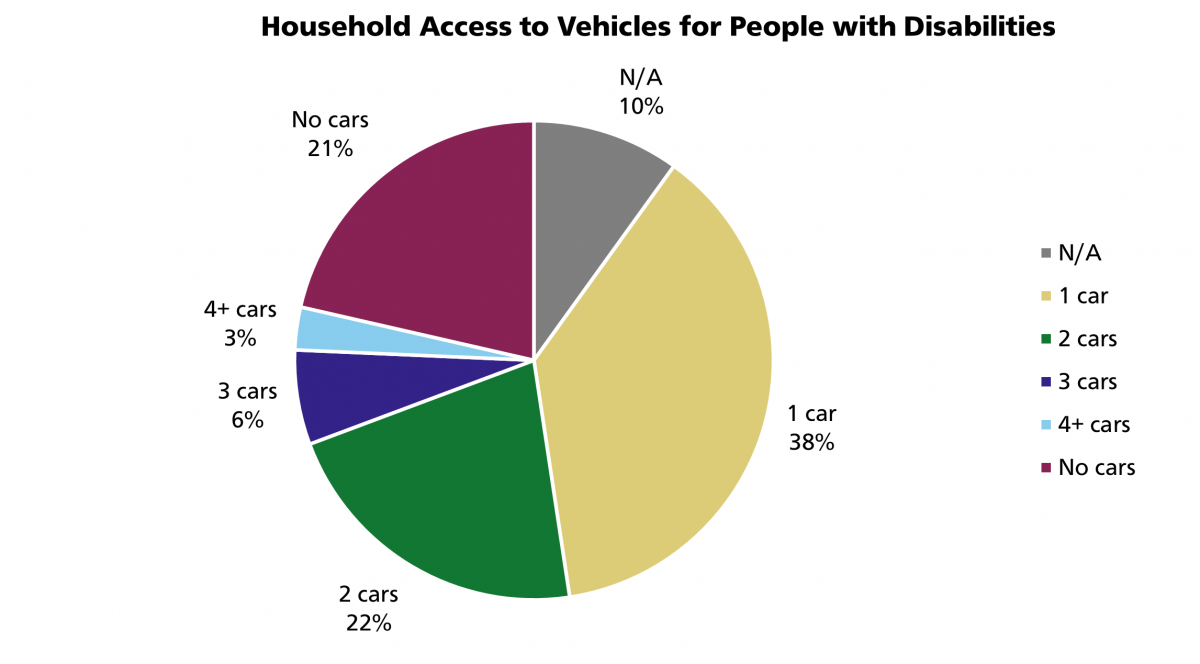
Accessible Text for Figure 10 .
Relevant Needs Assessments
Agencies throughout the City and County of San Francisco work collaboratively to promote health, safety, and independence for older adults and people with disabilities. The SFMTA looks to a range of needs assessments conducted by our peer agencies to better understand the experiences and needs of the populations we serve.
Dignity Fund Assessment The Dignity Fund was established in 2016 to create protected funding for social services for older people, adults with disabilities, veterans and caregivers. San Francisco’s Department of Disability and Aging Services administers the Dignity Fund and conducts the Dignity Fund Community Needs Assessment every four years to gather community input on the needs of older adults and people with disabilities. The Needs Assessment then informs the Dignity Fund Services and Allocation Plan. The FY2021-2022 Needs Assessment found that consumer concerns and needs relating to safety, mobility and transportation have been exacerbated by the COVID-19 pandemic and racialized violence. A key priority of the FY23-24 to FY26-27 Services and Allocation Plan is to Ensure Multimodal Service Access, with a focus on ensuring older adults and people with disabilities can participate in in-person services and more generally as full members of our community.
Age and Disability Friendly San Francisco Action Plan The Department of Disability and Aging Services launched San Francisco’s Age and Disability Friendly Action Plan in 2018. The latest Action Plan includes 10 recommendations, focused across four domains and includes items such as policy proposals, program pilots, research initiatives and advocacy. The Transportation domain of the Plan covers the infrastructure, equipment and services for all means of urban transportation, with a focus on transportation services and policies specifically related to people with disabilities and seniors. The three Transportation domain goals, or recommendations, that will be prioritized are:
- Transportation information should be available in a variety of accessible formats and devices.
- Ensure Accessibility Oversight: Assess and provide recommendations on accessibility design and/or decision-making.
- Prioritize ramp taxi advocacy and policy.
Investment of Funds to Support the Black Community in San Francisco In 2020, Mayor Breed and Board President Shamann Walton announced a plan to prioritize the redirection of resources from law enforcement to the Black community. The San Francisco Human Rights Commission (HRC) facilitated over a dozen meetings with nearly 600 community stakeholders including youth, adults, faith-based leaders and HOPE SF residents, for input on how to allocate the $120 million. HRC’s final report urged strengthening support systems for Black seniors, particularly elders who need financial support to meet basic needs.
San Francisco Homeless Count & Survey Comprehensive Report 2022 In 2022, the San Francisco Department of Homelessness and Supportive Housing (HSH) released their biennial comprehensive report analyzing the results of their point-in-time count and survey. The point-in-time count, conducted on February 23, 2022, found that 7,754 people in San Francisco were experiencing homelessness. Homelessness has many intersections with disability and aging populations, and 25% of unhoused people in San Francisco are over the age of 50. Sixty percent (60%) of respondents reported living with one or more health conditions. These conditions included chronic physical illnesses, physical disabilities, chronic substance use and severe mental health conditions. The unemployment rate for homeless survey respondents was 83%. Among respondents who were unemployed, the primary barriers to employment included alcohol/drug issues (23%), disability (14%) and mental health issues (12%). Finally, a much higher proportion of survey respondents identified as Black or African-American than the general population (35% compared with 6%).
Paratransit Rider Profiles
SF Paratransit collects certain demographic information for applicants when they apply for either the ADA Paratransit program or enroll in the ETC program. Among the relevant data points that are collected include the age of participants, where they reside, and whether they utilize a mobility aid. For those applying for ADA Paratransit, we added a voluntary question regarding the applicant’s race/ethnicity information in June 2020.
In addition to the information collected through applications, the ADA Paratransit riders selected to participate in our annual Paratransit Customer Satisfaction Survey can also share their race/ethnicity, income and language preferences, allowing us to draw some general conclusions. Survey participants are active riders who completed a recent trip during the survey period.
Race and Ethnicity
Voluntary demographic information provided in ADA paratransit applications since June 2020 provides a snapshot rider race and ethnicity: 28% identify as Asian, 24% as White, 21% as Black/African-American, and 10% as Latino in their application forms; 25% of all applicants did not answer this question.
Additionally, according to demographic data from the 2022 Paratransit Customer Satisfaction Survey, 43% of paratransit riders identify as White, 22% as Black/African-American, 18% as Asian/Pacific Islander, 13% as Latino/Hispanic, and 2% as Native American. Less than 1% of riders identified as Other (Unspecified) and 5% elected not to answer.
Both sources present limitations to understanding the demographics of all ADA paratransit customers. While the Customer Satisfaction Survey results are considered statistically significant, demographic questions are optional. The demographic information provided in applications over the past four years may provide a better snapshot of the demographic makeup of newer riders. However, the large percentage (25%) of those who did not respond to this question when filling out their application means we have an incomplete picture of the racial/ethnic background of participants in the ADA Paratransit program.
SF Paratransit also collects race and ethnicity data when enrolling into the ETC program. However, a high percentage of respondents (65%) did not state their race or ethnicity. Among those who did, 15% stated they were Asian, 11% White, and 3% Black/African American and Latino.
Language
SF Paratransit ensures that all essential communications are available in the preferred language of our riders. This includes the ADA Eligibility Application and Rider’s Guide, which are available in accessible formats and multiple languages. Additionally, SF Paratransit provides language interpretation for all interviews and appeal hearings. Title VI notices are also posted on all SF Paratransit vehicles.
When completing the ADA Paratransit application, individuals provide their preferred language. Among applicants, 60% indicated English as their preferred language, with 18% Chinese, 9% Russian, 7% Spanish, and 2% Filipino/Tagalog; all other languages had less than 1% response. Only 1% of applicants did not respond to this question, providing a fairly accurate picture of the preferred language of our ADA Paratransit ridership. In the 2022 Paratransit Customer Satisfaction Survey, 77% reported speaking English, 8% Spanish, 8% Russian, 5% Chinese, 3% Tagalog, 1% Japanese, and < 1% German.
Riders also provided their preferred language at the time of enrollment for the ETC program. 63% indicated English as their preferred language, with 16% Chinese, 3% Russian, and 2% Spanish; all other preferred languages can be attributed to less than 1% of responses. Approximately 14% of riders did not indicate a preferred language.
SF Paratransit ensures that all essential communications are available in the preferred language of our riders. This includes the ADA Eligibility Application and Rider’s Guide, which are available in accessible formats and multiple languages. Additionally, SF Paratransit provides language interpretation for all interviews and appeal hearings. Title VI notices are also posted on all SF Paratransit vehicles.
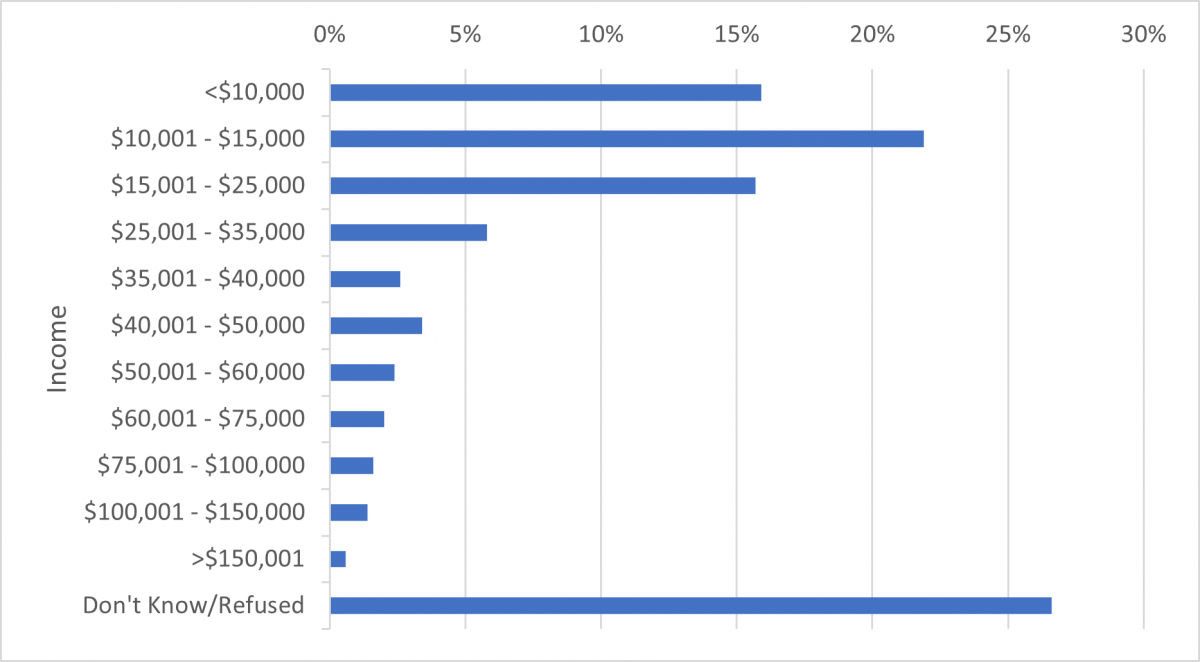
Income
The cost of living in San Francisco is high for everyone, but it can be especially challenging for seniors and people with disabilities. The self-reported median income of a Paratransit rider was $24,520, which is lower than San Francisco’s median household income of $126,187. The income of paratransit riders aligns more closely with the income of seniors in San Francisco than the general population. For example, the federal poverty rate is 15.6 percent among seniors, which is higher rate than the overall population (8.6 percent).[16]
Figure 11. Self-reported incomes of SF Paratransit Riders
Age
The average age of SF Access Paratransit riders is 70.5 years while the average age of SF Paratransit Taxi riders is slightly older at 75.1 years.
Neighborhood
Paratransit riders live throughout the city. The first map and data table below show the distribution of enrolled SF Paratransit riders’ home residences across San Francisco’s Supervisor Districts. The highest concentrations of Paratransit riders are found in centrally located District 5 (19.1% of enrolled riders), and Districts 6 (10.2%) and 10 (9.5%) to the east. The high concentration of SF Paratransit riders in these areas correlate to the locations of congregate housing site for seniors and individuals with disabilities.
As seen in the following maps and data tables, the highest concentration of active SF Access (15.6%) and Paratransit taxi (23.3%) riders live in District 5. A higher concentration of active SF Access riders live in Supervisor Districts 7 (9.4%), 10 (14%) and 11 (11.7%) than SF Paratransit Taxi riders in the city’s southern end, while a higher share of SF Paratransit taxi riders live in Supervisor Districts 1 (6.7%), 2 (8.4%) and 3 (9.6%) to the north. These differences could be attributed to the historical availability of taxis in San Francisco, which has been generally in the downtown areas as well as near major hospitals. Those in the less dense, residential neighborhoods of San Francisco, such as Supervisor Districts 7, 10 and 11, may be more reliant on SF Access service as taxis are generally not readily available in those areas.
Figure 12. Home Residences for Active SF Access Paratransit Riders FY21-22, by Supervisor District
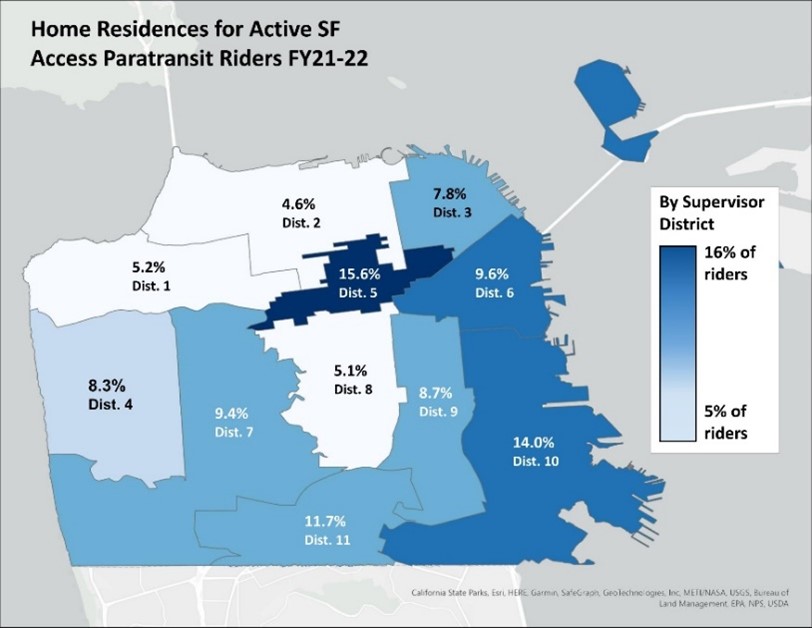
Accessible Text for Figure 12.
Figure 13. Home Address for Active SF Paratransit Taxi Riders FY21-22, by Supervisor District
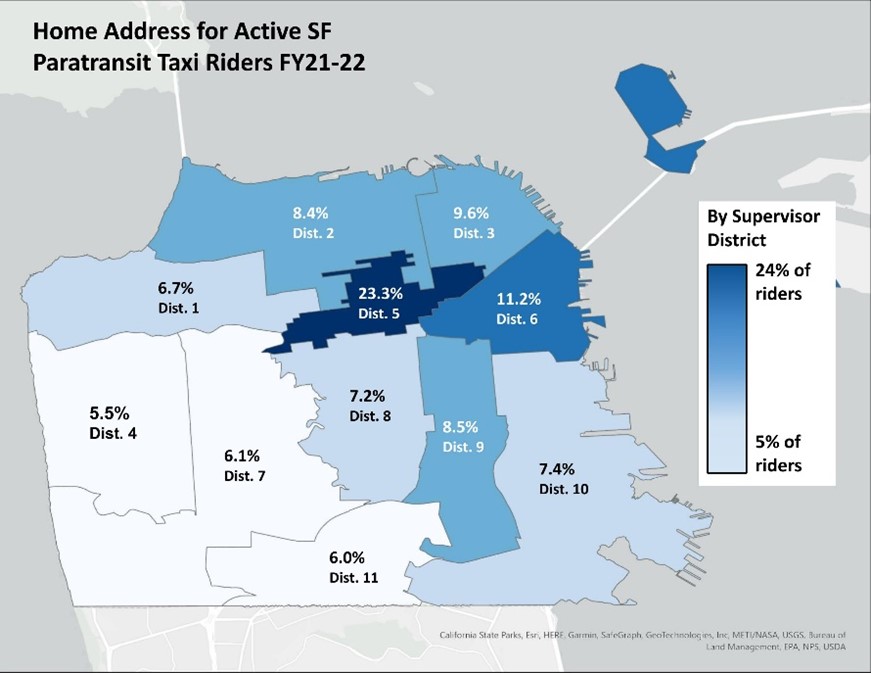
Accessible Text for Figure 13.
Housing Type
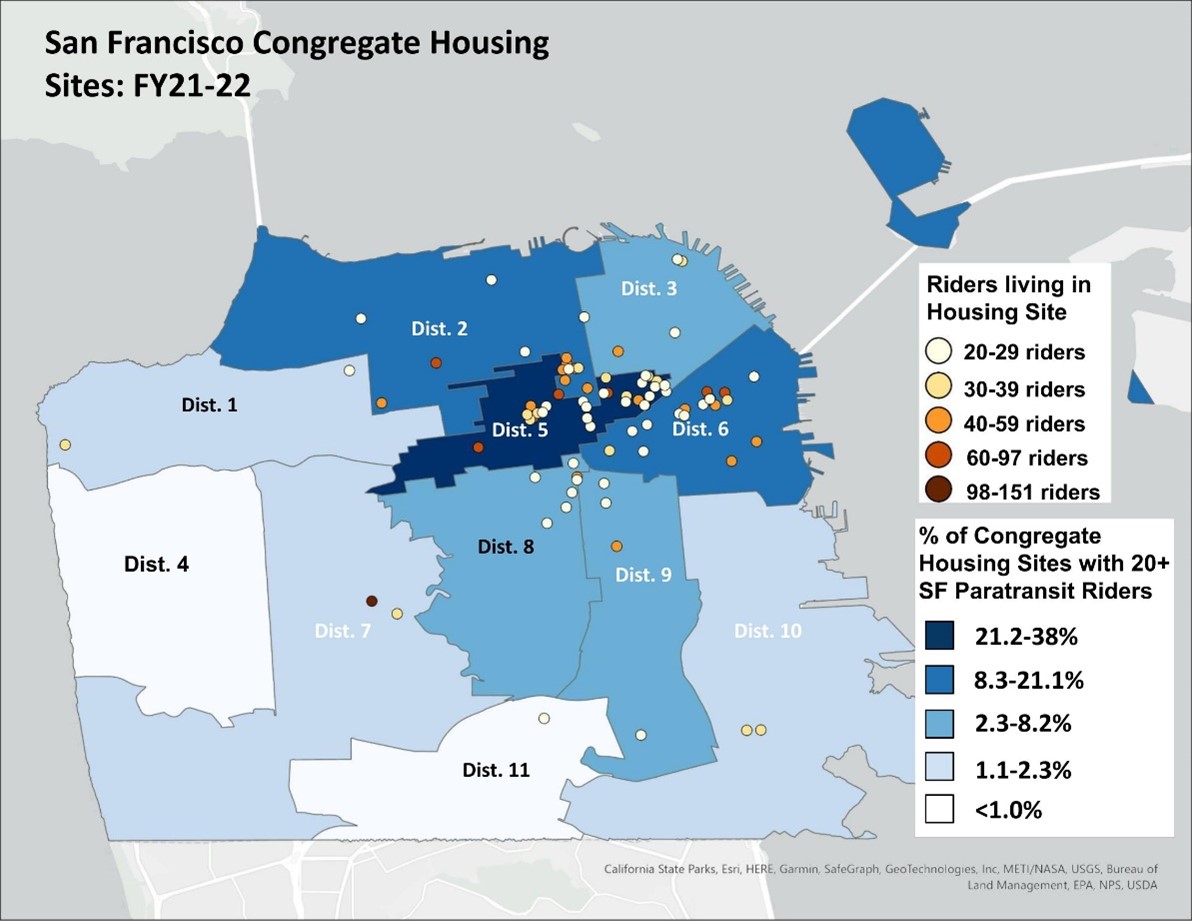
Many paratransit riders live in congregate housing sites where households share common spaces or are designated sites for seniors and individuals with disabilities. Examples of congregate housing include single resident occupancy hotels (SROs), permanent supportive housing and public housing sites. In FY21-22, 3,247 paratransit riders (28%) lived in congregate housing sites that housed 20 or more riders. Trends in the distribution of congregate housing sites with 20 or more paratransit riders and of riders living in congregate housing sites among San Francisco’s supervisor districts can be seen in the visuals and accompanying data tables below. Many of these sites are clustered in districts 2, 5 and 6. This correlate to the neighborhoods with the highest percentage of active Paratransit riders.
Figure 14. San Francisco Congregate Housing Sites, FY21-22, by Supervisor District
Accessible Text for Figure 14.
Disability Type and Eligibility Type
Approximately 39% of riders are fully eligible for ADA paratransit service, while 61% are conditionally eligible. Conditionally eligible means that a rider may qualify to use the Paratransit service if conditions such as weather or access barriers such as steep slopes or distance to a bus stop prohibit them from using the fixed route system. During eligibility determinations, SF Paratransit eligibility analysts learn more about a rider’s disability and functional abilities to make this determination. The most common disability reported among riders of both SF Access and SF Paratransit Taxi services are ambulatory disabilities, motor/coordination disorders and neurological disorders. Many Paratransit users have multiple disabilities and or health conditions that impact their functional abilities to use fixed route transit.
Figure 15. Disability Types Reported During Paratransit Enrollment, FY22

Accessible Text for Figure 15.
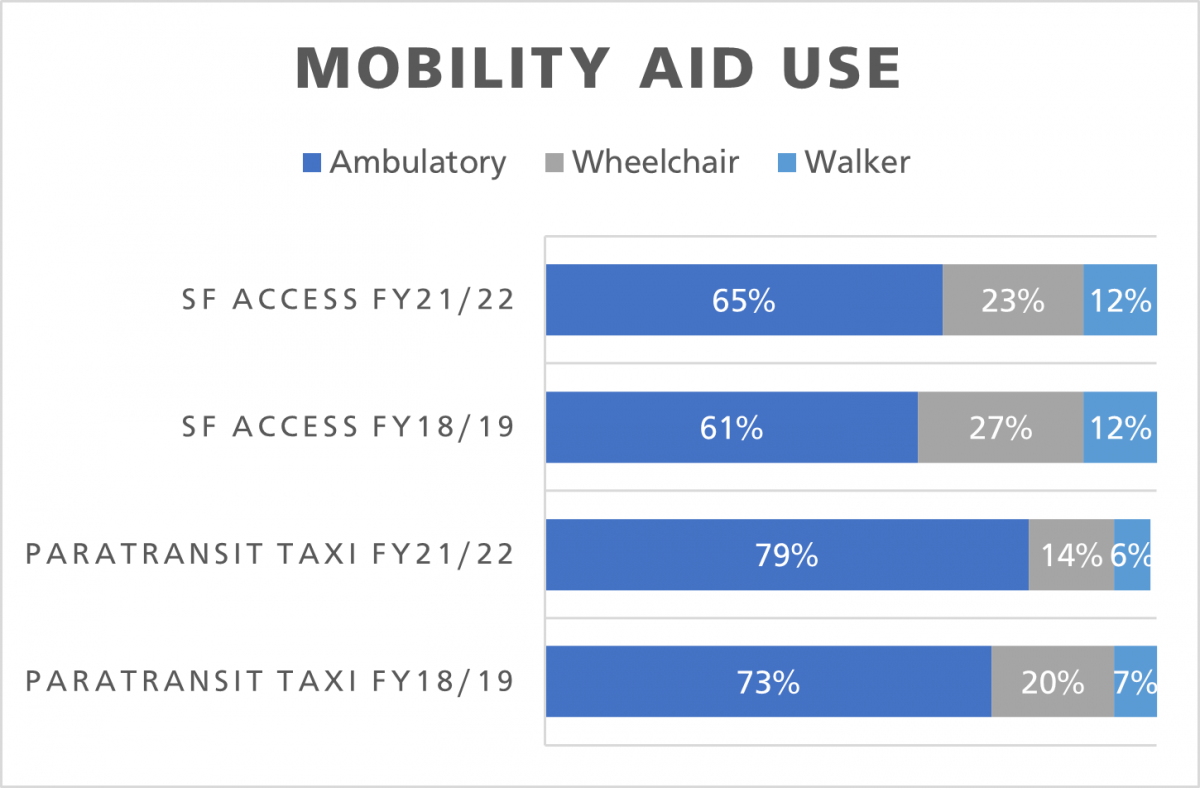
Mobility Aid Use
In FY21/22, approximately one-third of SF Access riders reported using a mobility aid (wheelchair or walker), while 20% or only one-fifth of SF Paratransit Taxi riders reported using a mobility aid. It is possible that mobility aid users benefit from the additional assistance provided by SF Paratransit operators, or that they find it more difficult to find wheelchair accessible taxis when they need to make their trips.
It is notable that the percentage of ambulatory riders in both programs increased between 4% (SF Access) and 6% (SF Paratransit Taxi) from FY18/19. Certification data corresponds with this trend and shows an 8% reduction in ambulatory disabilities between the two years. This trend is possibly related to the pandemic because non-ambulatory riders may have been more vulnerable to COVID-19. As people who are not ambulatory may feel more vulnerable, they likely reduced their Paratransit trips. Additionally, service reductions to Muni, particularly to local neighborhood feeder routes, may have led to more individuals with limited mobility to apply and use Paratransit to complete trips that they would have otherwise completed via bus or rail.
Figure 16. Mobility Aid Use by Paratransit Service, FY18/19 and FY21/22
Accessible Text for Figure 16.
[1] American Community Survey 2021 5-year Sample, Tables S0101 and S1810
[2] 2023 San Francisco City Survey
[3] American Community Survey 2021 5-Year Estimates, IPUMS 1990 5% sample
[4] American Community Survey 2021 5-year Sample, Table S0102
[5] American Community Survey 2021 5-year Sample, Table B08101
[6] U.S. Social Security Administration, OASDI Beneficiaries by State and County, 2019
[7] American Community Survey 2021 5-year Sample, Table S0102
[8] American Community Survey 2021 5-year Sample, Table C18108
[9] San Francisco In-Home Supportive Services (2020)
[10] American Community Survey 2021 5-year Sample, Table C18120
[11] American Community Survey 2021 5-year Sample, Table C18130
[12] American Community Survey 2021 5-year Sample, Table B18135
[13] 2023 San Francisco City Survey
[14] 2023 San Francisco City Survey
[15] Steven Ruggles, Sarah Flood, Matthew Sobek, Danika Brockman, Grace Cooper, Stephanie Richards, and Megan Schouweiler. IPUMS USA: Version 13.0 [dataset]. Minneapolis, MN: IPUMS, 2023. https://doi.org/10.18128/D010.V13.0
[16] American Community Survey 2021 5-year Sample, Table S0102