Use these links to jump to sections on this page:
Paratransit Service Overview
Ridership
Frequent Origins and Destinations
Reliability
Customer Feedback and Requests
Identified Needs for Paratransit Service Performance
Paratransit Service Overview
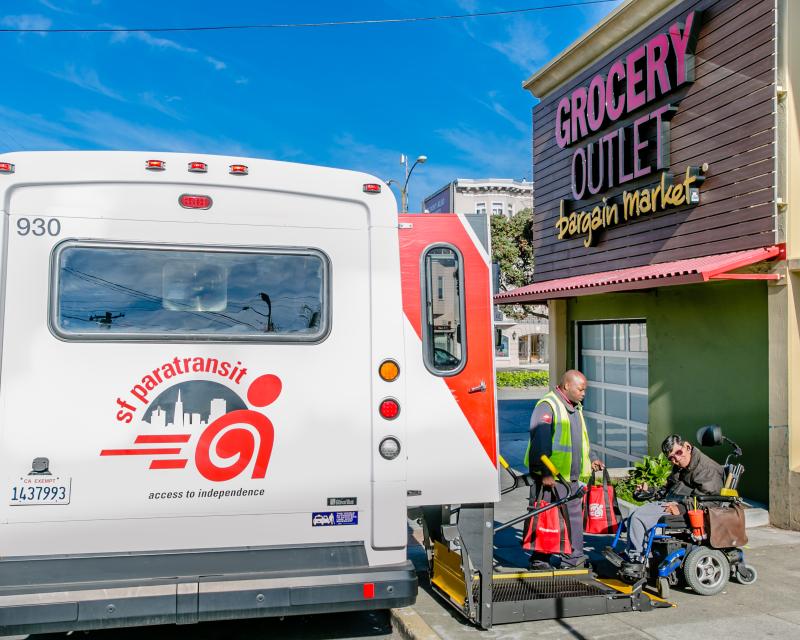
Since 1990, the Americans with Disabilities Act (ADA) has required public transit agencies that provide fixed-route service to provide “complementary paratransit” services to people with disabilities who cannot use the fixed-route bus or rail service because of a disability. The ADA regulations define this service as a civil right and specify minimum standards of service that must be met to be considered equivalent to the fixed-route service it is intended to complement. In general, ADA complementary paratransit service must be provided within 3/4 of a mile of a bus route or rail station, at the same hours and days, for no more than twice the regular fixed route fare.
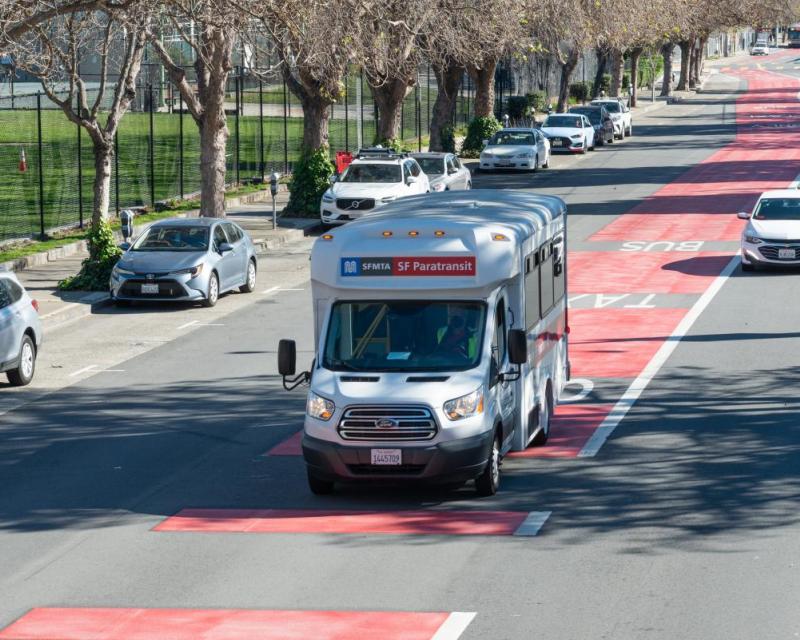
The SFMTA is proud of the fact that Muni has provided paratransit services since 1978 with guidance from the Paratransit Coordinating Council (PCC). This was because of extensive community advocacy, particularly the advocacy and demonstrations in 1977 to push for the implementation of Section 504 of the Rehabilitation Act of 1973, and later the ADA in 1990. The SFMTA now provides three services under its ADA Paratransit umbrella, including SF Access van service, SF Paratransit taxi and Group Van services. The SFMTA partners with a contractor, Transdev, to manage and deliver the services. Transdev provides some of the van services directly and coordinates with taxi companies and other van providers to offer additional services. In addition, Transdev is responsible for the day-to-day management of the Paratransit program, including ADA eligibility certification, fare media sales, subcontracting of transportation services, service quality monitoring and customer interface.
The services under the SF Paratransit umbrella include SF Access Paratransit, SF Paratransit Taxi, Group Van service, Shop-a-Round shuttles, the Essential Trip Card Program (ETC), the Van Gogh Recreational program, and special pilot programs to fill gaps in transportation for older adults and people with disabilities. The SF Paratransit program also houses the Mobility Management Center, a one-stop-shop for older adults and people with disabilities to access transportation information, resources and referrals tailored to an individual’s needs, including individual and group travel training.
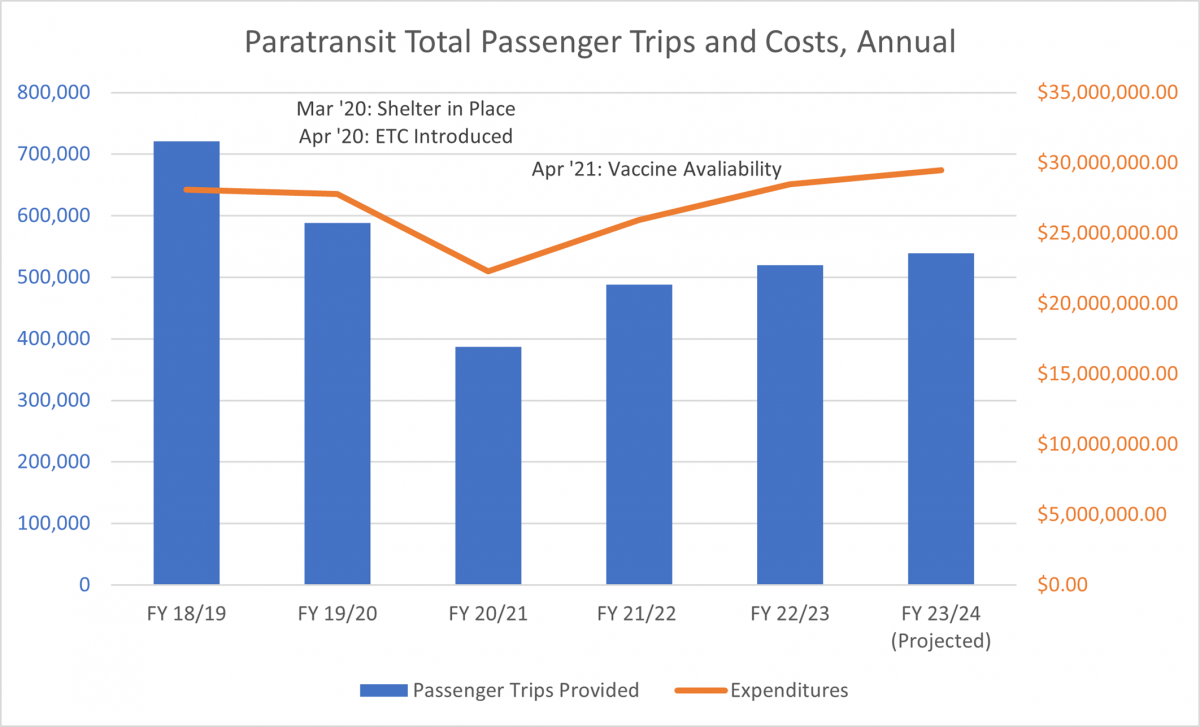
In FY19, 12,641 riders were registered in the SF Paratransit program, completing 720,807 van and taxi trips. In FY23, the total number of registered riders decreased slightly to 11,329 with another 6,284 enrolled in non-ADA transportation services. In FY23, 519,626 total trips were performed to all riders.
Figure 1. Paratransit Total Passenger Trips and Costs, Annual
Ridership
SF Access: In FY19, SF Access provided 206,659 trips. In FY23, during the pandemic demand decreased by approximately one-third and SF Access completed 161,980 trips. Demand for Stair Assist rides, wherein an operator and bus aide assist a rider using a wheelchair to maneuver up and down the exterior stairs of their home, decreased by 74% from FY19 to FY23, whereas demand for ambulatory and wheelchair trips only decreased by 19% and 27% respectively.
Figure 2: Table of Types of SF Access Trips, FY19 and FY23
|
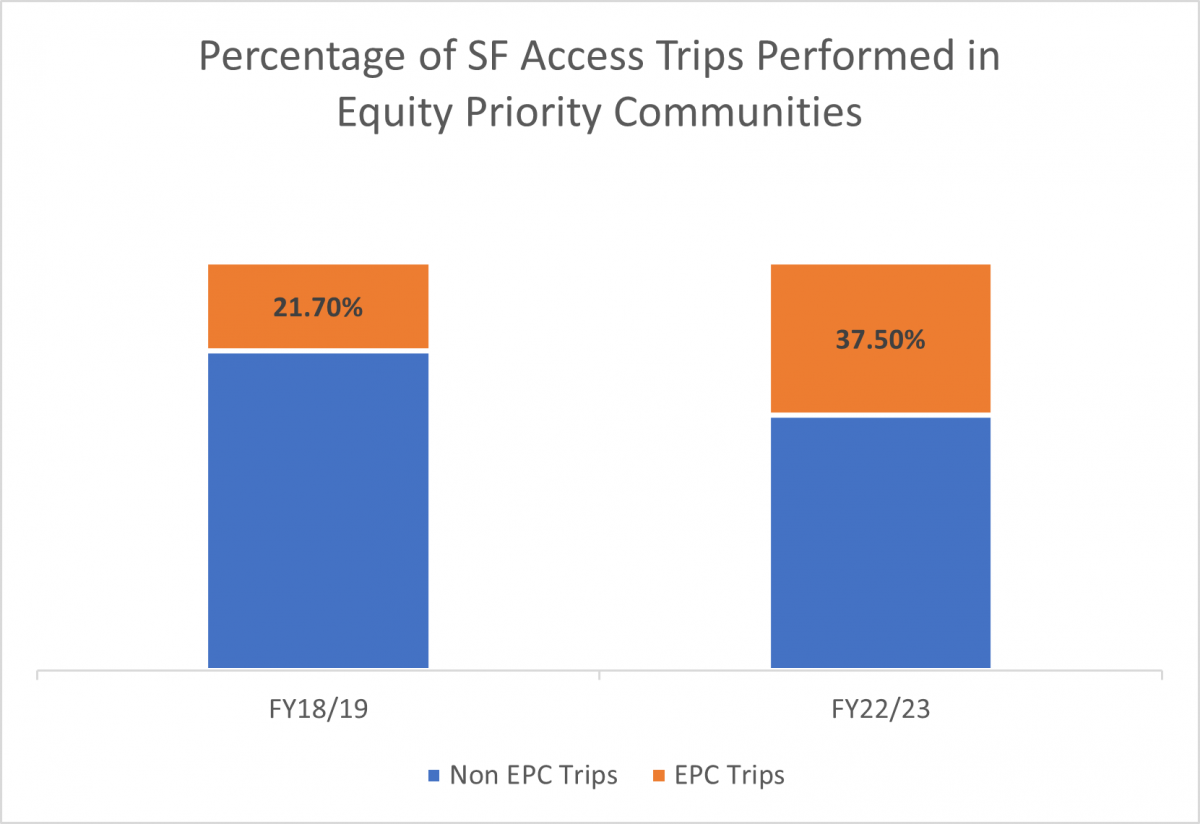
While SF Access trips decreased 22% citywide from FY19 to FY23, trips performed in Equity Priority Communities increased by 37%, from 21.7% to 37.5% of all trips. This is likely related to two separate factors. The first factor is that Equity Priority Communities are characterized by having a high proportion of low-income households. Lower rates of car ownership and less access to alternative transportation means that individuals living in these communities are more reliant on services like ADA Paratransit. Additionally, there are several frequent origins and destinations that provide essential services located in Equity Priority Communities, including DaVita Chinatown Dialysis and DaVita Dialysis Webster. While nonessential travel was reduced during the pandemic, travel to essential services, like dialysis, maintained their ridership level due to the life-sustaining nature of this treatment.
Figure 3. Percentage of SF Access Trips Performed in Equity Priority Communities
SF Paratransit Taxi: In FY19, SF Paratransit Taxi provided 320,793 trips. In FY23, demand decreased by approximately 39% and SF Paratransit Taxi completed 196,796 trips. Demand for ambulatory trips decreased by 39% while demand for ramp taxi trips decreased only 18%.
Figure 4. SF Paratransit Taxi Trips, FY19 and FY22
| SF Paratransit Taxi Trips | FY19 | FY22 | Change |
|---|---|---|---|
| Trips Performed | 313,920 | 196,796 | -37% |
| Sedan | 307,047 | 191,180 | -38% |
| Ramp Taxi | 6,873 | 5,616 | -18% |
While trips decreased 39% citywide from FY19 to FY22, trips performed in Equity Priority Communities remained steady at 45% of all taxi trips performed. The overall reduction in the number of taxi trips taken by both riders citywide could be attributed to the systemic and behavioral changes from the COVID-19 pandemic. Due to the same day nature of the taxi program, these trips are more likely to be non-essential trips that are not as time sensitive. COVID-19 surges may have affected the confidence of riders to resume non-essential social activities over the past three years. Additionally, there has been a push to utilize technology to replace in-person activities, such as remote medical appointments, digitizing applications, and creating new online portals. However, much like SF Access riders, there were no changes in the percentage of taxi trips completed in the Equity Priority Communities as many individuals continued to use taxis to obtain essential services.
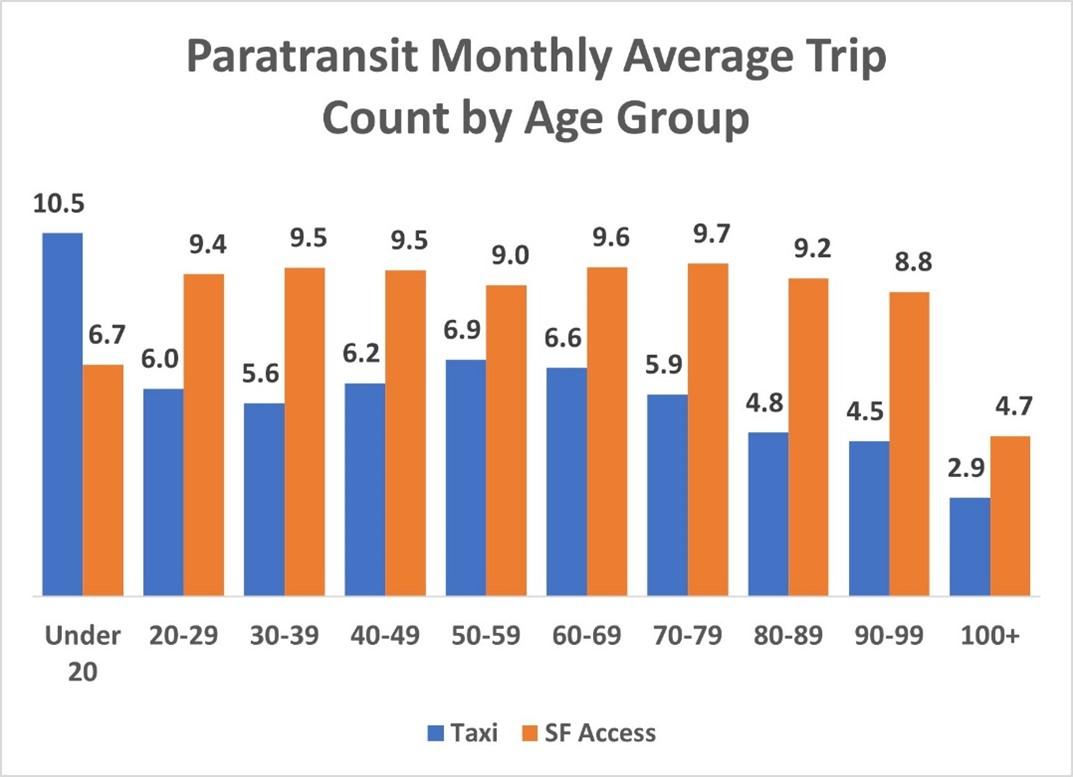
Active SF Paratransit riders take, on average, more SF Access trips than taxi trips each month. The average number of SF Access trips completed is consistent among the vast majority of active riders, with a monthly average between 8.8 and 9.7 trips among those between the ages of 20 and 99 years old. Meanwhile, the active riders who frequent taxi services more often are generally younger, with the greatest average usage among those younger than 80 years old. This could be attributed to the different policies between the two services. Whereas there are no restrictions to the number of SF Access trips that can be completed, each SF Paratransit taxi rider is given a monthly allotment for the taxi service, limiting the number of taxi trips they can take each month.
Figure 5. Paratransit Monthly Average Trip Count by Age Group
Group Van: In FY18-19, the group van service transported over 150,000 passenger trips to and from 15 day centers. Due to pandemic closures, in FY22-23, this service transported 55,000 trips to and from 10 centers. Additionally, the percentage of trips in neighborhoods identified as Equity Priority Communities was 44% of the total group van ridership.
Group van ridership was at about 40% of pre-pandemic levels in FY23. Trip data shows that day centers have fewer active participants who are attending less frequently than in FY19. In FY23, we experienced drops of 1% and 22% among participants who ride Group Van service four and five times a week and an increase in those who only attend these centers one to two times a week. This resulted in a 21% decrease in the average number of trips completed by a Group Van rider in FY23 when compared to FY19. Given that the state of California eliminated the remote telehealth options that were available during the COVID-19 pandemic and many agencies are funded based on attendance, this drop in ridership could be attributed to hesitance from participants to engage in group activities due to pre-existing health conditions that could be aggravated by any potential infection.
Figure 6. Table of Group Van Ridership, FY 19 and FY23
| Group Van | Total Riders | 1x/week | 2x/week | 3x/week | 4x/week | 5x/week | Average Per Week |
|---|---|---|---|---|---|---|---|
| FY19 | 664 | 4% | 7% | 18% | 14% | 56% | 4.14 |
| FY23 | 348 | 10% | 23% | 18% | 15% | 34% | 3.40 |
Essential Trip Card: As of June 30, 3034, the ETC program provided 326,057 trips. It started in April 2020 to supplement service to the reduced Muni routes and experienced tremendous growth during the initial months as seniors and people with disabilities utilized this service to complete essential trips, such as grocery shopping and attending medical appointments. In March 2021, there was a large increase with over 7,900 trips taken; this coincided with the availability of the COVID-19 vaccine to seniors and people with disabilities. Since then, the number of ETC trips has remained steady at around 6,000–7,000 trips each month despite continued enrollment among the senior and disabled population. This indicates that as Muni continues to reintroduce service, participants are continuing to use the ETC program to complement their Muni trips.
Figure 7. Number of ADA Paratransit Taxi and ETC Trips
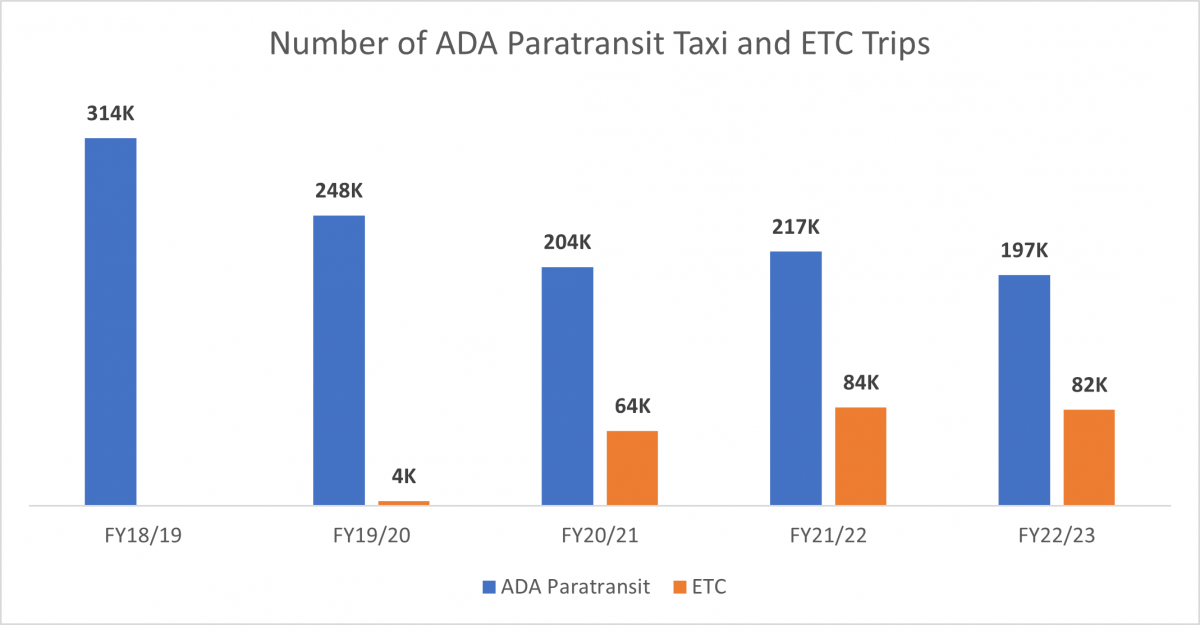
ETC trip counts indicate that the program continues to increase in popularity, even since the height of pandemic-related shutdowns. Since FY20, the number of annual ETC trip counts increased from 4,000 to 84,000 in FY22 and remained steady through FY23. ADA Paratransit taxi trips continue to outpace ETC trips each year during that timeframe, but the proportion of all taxi trips that are ETC trips is increasing. In FY23, there were 197,000 ADA paratransit taxi trips to 82,000 ETC trips. By comparison, prior to the creation of the ETC program, there were 314,000 total paratransit taxi trips in FY19. Additionally, in FY23, 37% of all ETC trips completed were in Equity Priority Communities.
Shop-A-Round: In FY18/19, there were 3,739 Shop-a-Round trips performed, with 55% of those trips being completed through the van service. Since then, there has been a decline in the number of trips completed through this service with only 1,845 trips completed in FY23. This decline could possibly be attributed to the introduction of the ETC program, which was promoted to the public as a taxi program for essential services, including grocery shopping. As indicated in the following section, eight of the most frequented destinations among ETC riders are grocery stores.
Figure 8. Number of Shop-a-Round Trips. FY18/19-FY22/23
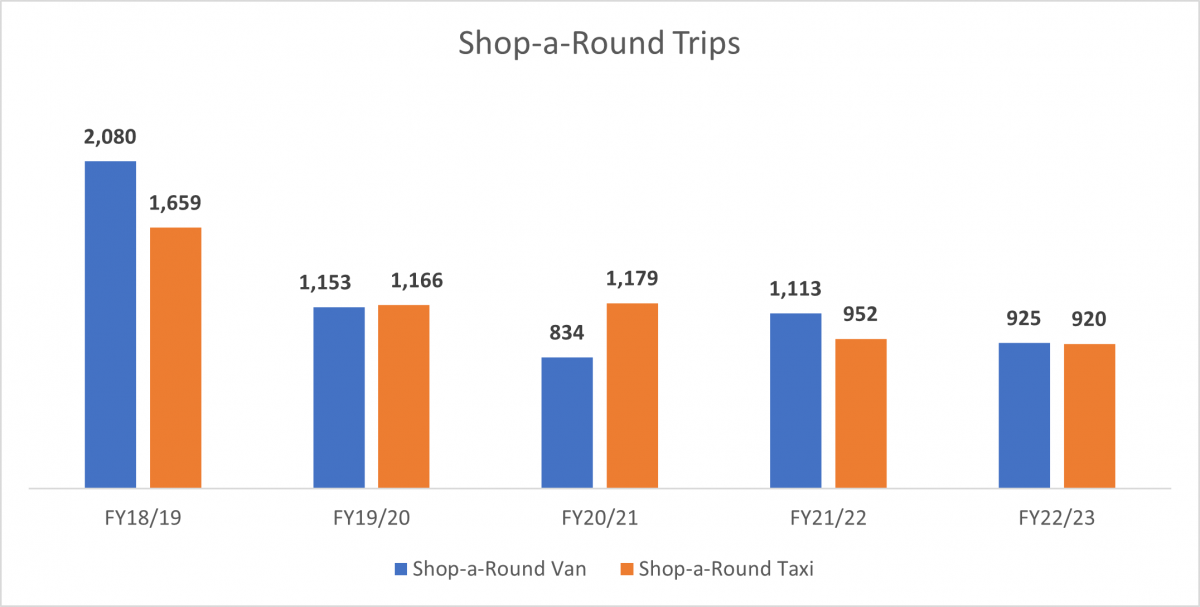
Given that the Shop-a-Round service was founded as a means of providing transportation to individuals living in food deserts, it is important to see how many trips are served in Equity Priority Communities. While there was a decline in the number of overall trips provided through Shop-a-Round, there was only a 5% reduction in the percentage of trips performed in Equity Priority Communities, from 51% in FY19 to 46% in FY23. Additionally, over 70% of Shop-a-Round taxi trips were taken in these neighborhoods.
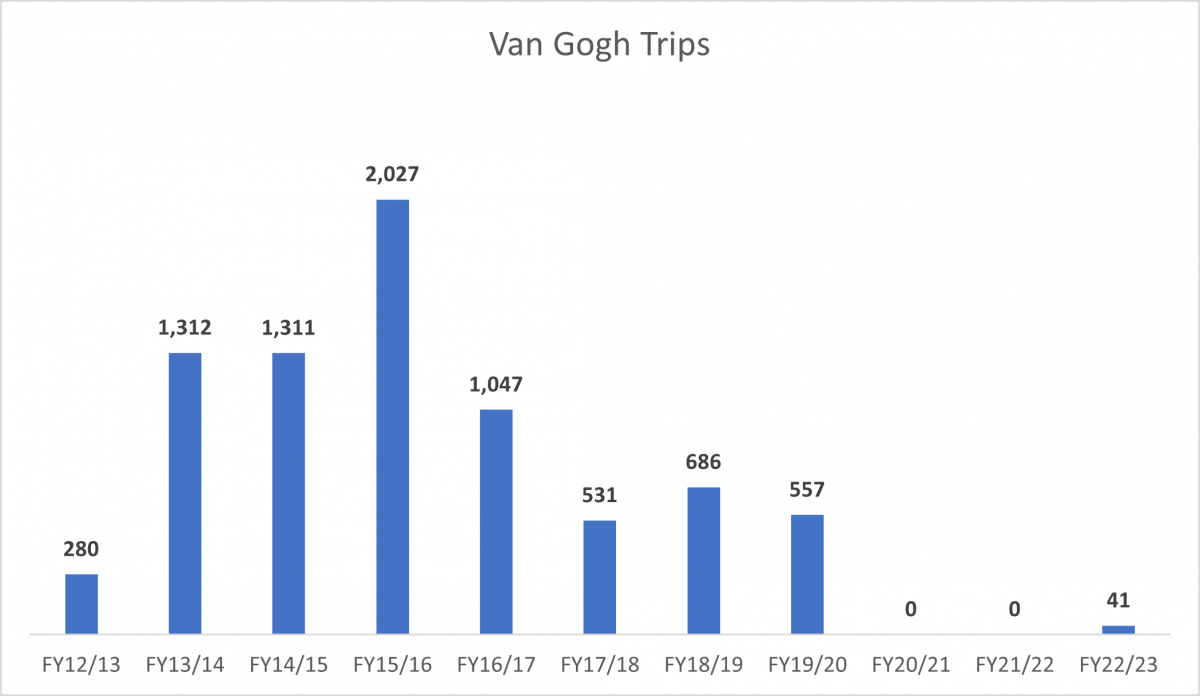
Van Gogh: During the first couple of years of its launch, the Van Gogh service saw steady growth, with a peak of 2,027 trips performed in FY16. However, since then, demand of this program has been reduced, with only 686 trips performed in FY19. During the COVID-19 pandemic, this service was suspended and was only recently restarted once all social distancing restrictions were removed.
Figure 9. Number of Van Gogh Trips, FY12/13-FY22/23
Frequent Origins and Destinations
SF Access: The most common origins and destinations for SF Access riders are healthcare facilities located throughout the city, in particular dialysis centers. The top 10 locations in FY23 include dialysis centers, hospitals/medical facilities, rehabilitation centers and adult day health care centers.
Figure 10. SF Access Common Origins and Destinations, FY19 and FY23
|
SF Access Common Origins and Destinations |
FY19 | FY23 |
|---|---|---|
| Total Trips | 206,659 | 161,980 |
| Fresenius Dialysis Ocean Avenue | 9,953 | 10,146 |
| Stepping Stone Mission Creek | 2,593 | 8,458 |
| Chinatown Dialysis | 10,919 | 7,700 |
| Satellite Dialysis California St | 6,953 | 7,219 |
| Zuckerberg San Francisco General Hospital | 6,045 | 5,613 |
| DaVita Golden Gate Dialysis | 1,543 | 4,730 |
| DaVita Dialysis Webster | 7,851 | 4,427 |
| Pomeroy Recreation & Rehabilitation Center | 11,855 | 4,256 |
| CPMC Pacific Campus | 7,581 | 3,631 |
| Stepping Stone Golden Gate | 6,327 | 2,505 |
SF Paratransit Taxi: The most common origins and destinations for SF Paratransit Taxi riders are more diverse than the common origins and destinations on SF Access. The top 10 locations include healthcare facilities, grocery stores, and the SF Paratransit office. The most common destinations are a smaller proportion of overall taxi trips when compared to the SF Access service. This supports the idea that taxi trips on Paratransit provide transportation for more social and recreational purposes.
Figure 11. SF Paratransit Taxi Common Origins and Destinations, FY19 and FY23
|
SF Paratransit Taxi Common Origins and Destinations |
FY19 | FY23 |
|---|---|---|
| Total Trips | 313,920 | 196,796 |
| SF General Hospital | 8,305 | 7,884 |
| Safeway Webster St | 3,756 | 3,185 |
| CPMC Pac Heights | 1,554 | 2,959 |
| Kaiser Geary | 4,191 | 2,917 |
| Costco | 3,130 | 2,660 |
| UCSF Parnassus | 6,789 | 2,564 |
| SF Paratransit Broker | 5,138 | 2,511 |
| Safeway Church St | 2,726 | 2,447 |
| Potrero Center | 1,830 | 2,307 |
| 2299 Post St, Post & Divisadero Pharmacy | 2,005 | 2,212 |
Group Van: As expected, the most common origin and destinations for those who participate in the Group Van service are the Adult Day Health Center and Adult Day Centers. These centers provide additional health services for riders as well as respite for their caregivers.
Figure 12. Group Van Common Origins and Destinations, FY 19 and FY23
|
Group Van Common Origins and Destinations |
FY19 | FY23 |
|---|---|---|
| Total | 145,438 | 55,751 |
| Jackie Chan Recreation Center | 26,979 | 18,100 |
| Stepping Stone Mission Creek | 16,981 | 6,851 |
| IOA Enrichment Center | 3,496 | 5,915 |
| Stepping Stone Mabini | 12,856 | 5,379 |
| Stepping Stone Golden Gate | 13,700 | 5,270 |
| Stepping Stone Presentation | 11,624 | 5,209 |
| Bayview Hunters Point Adult Day Health Center | 16,981 | 4,073 |
| Catholic Charities Day Center | 4,981 | 3,606 |
| Self Help For the Elderly Raymond | 0 | 2,211 |
| The Arc | 12,555 | 1,463 |
Essential Trip Card: Much like those enrolled in the SF Paratransit taxi program, the destinations with the highest number of ETC riders are either grocery stores or medical facilities. This aligns with the goal of the program, which was to help participants complete essential trips; while the definition of an “essential trip” is up to the participant, generally, it has been promoted as a transportation service to assist those who need food or medical services.
Figure 13. Essential Trip Card Common Origins and Destinations
|
ETC Common Origins and Destinations |
Trips |
|---|---|
| Kaiser Geary | 1,963 |
| Safeway Church St | 1,862 |
| SF General Hospital | 1,766 |
| Costco | 1,399 |
| UCSF Parnassus | 1,032 |
| Safeway Webster St | 1,010 |
| CPMC Pac Heights | 919 |
| Trader Joes Hyde | 899 |
| CPMC Davies | 705 |
| Potrero Center | 672 |
Shop-a-Round: The Shop-a-Round van service operates based on a set weekly schedule to certain grocery stores. The top three common locations share common characteristics including being located in the southwestern area of San Francisco and in shopping areas with other services and retailers. Clients may gravitate towards these grocery store locations as they offer the opportunity to complete other shopping needs.
Figure 14. Shop-A-Round Van Common Origins and Destinations, FY 19 and FY23
|
Shop-a-Round Van Common Origins and Destinations |
FY19 | FY23 |
|---|---|---|
| Trader Joe's Westlake | 202 | 346 |
| Safeway Westlake | 390 | 214 |
| Lucky Lakeshore Plaza | 481 | 165 |
| Costco | 104 | 55 |
| Safeway Diamond Heights | 312 | 47 |
| Safeway Church St | 158 | 20 |
| Trader Joe's 9th St | 70 | 14 |
| Safeway Bay St | 12 | 12 |
| Foods Co | 190 | 11 |
| Safeway Webster St | 30 | 3 |
The Shop-a-Round taxi service operates differently than the van service, allowing riders to use their debit card to pay for the meter fare to any grocery store in San Francisco. While both services have some shared locations that are popular among riders, the Shop-a-Round taxi service also frequent serve locations that do not have large parking lots that could support a Paratransit cutaway vehicle.
Figure 15. Shop-A-Round Taxi Common Origins and Destinations, FY 19 and FY23
|
Shop-a-Round Taxi Common Origins and Destinations |
FY19 | FY23 |
|---|---|---|
| Costco | 56 | 91 |
| Trader Joe's Hyde | 77 | 83 |
| Safeway Church St | 117 | 67 |
| Safeway Webster St | 62 | 33 |
| Foods Co | 4 | 15 |
| Trader Joe's 9th St | 57 | 15 |
| Lucky Fulton St | 6 | 14 |
| Safeway 7th Ave | 4 | 14 |
| Safeway Marina | 19 | 13 |
| Target West | 19 | 13 |
Reliability
SF Access: The reliability of paratransit service can be measured by on-time performance. An SF Access trip is considered on-time if the vehicle arrives within a 20-minute window, which is five minutes before or 15 minutes after the scheduled pick-up time. On-time performance is collected through the Trapeze scheduling software. When the driver arrives at the destination, the data is transmitted through the onboard Trapeze tablets.
Pre-COVID, in FY19, 79% of SF Access trips were on-time, 19% of trips were performed 15 minutes late or more, and 2% went unfulfilled because a rider gave up on the trip, cancelled at the door, or did not show.
In FY23, on-time performance improved significantly, likely due to the reduction in service demand while maintaining the necessary driver staffing levels. In FY23, almost 98% of SF Access trips were on-time, about 2% of trips were 15 minutes late or more, and 0.2% of trips went unfulfilled because a rider cancelled at the door or found alternative transport.
Figure 16. SF Access Reliability, FY19 and FY23
| SF Access Trips | FY19 | FY23 | Change |
|---|---|---|---|
| Trips Scheduled | 206,659 | 161,980 | -37% |
| On Time | 79% | 97.4% | +18.4% |
| Late (15 minutes+) | 19% | 2.4% | -16.6% |
| Missed | 2% | 0.2% | -1.8% |
When we examine on-time performance by time of day, the most significant improvement occurred during the evening hours (4 p.m.-10 p.m.) as it had consistently been the most difficult window to provide on-time service. SF Access on-time performance is likely lower in the evening hours because there are fewer drivers working at this time as well as increased congestion from rush hour traffic.
Figure 17. SF Access On Time by Time of Day, FY19 and FY23
| Service | FY19 | FY23 | % Improvement |
|---|---|---|---|
| Morning (4AM – 12PM) | 73.26% | 97.86% | 24.60% |
| Afternoon (12PM – 4PM) | 67.75% | 97.56% | 29.81% |
| Evening (4PM – 10PM) | 60.18% | 96.35% | 36.17% |
| Night (10PM – 4AM) | 67.72% | 96.39% | 28.67% |
SF Paratransit Taxi: A Paratransit taxi trip is considered on-time if the vehicle arrives within 30 minutes of the request. SF Paratransit staff collect the on-time performance data by surveying riders with a recent taxi trip to ask if their vehicle arrived within 30 minutes of their requested pick up time.
Pre-COVID, in FY19, 96% of SF Paratransit taxi trips were on-time while 4% of trips were 30 minutes late or more. In FY23, almost 93% of SF Paratransit taxi trips were on-time while 7% of trips were 30 minutes late or more.
Group Van: A Group Van trip is considered on-time if the vehicle arrives within 30 minutes of the scheduled drop off time at the agency. On-time performance is collected through the Trapeze once the driver arrives at the destination and transmit the data through the onboard tablets.
Pre-COVID, in FY19, 87% of Group Van trips were on-time while 13% of trips were 30 minutes late or more. In FY23, almost 91% of Group Van trips were on-time while 9% of trips were 30 minutes late or more. On time performance increased by almost 4%.
Customer Feedback and Requests
SF Access: SF Paratransit conducts an annual customer satisfaction survey among Paratransit riders to gauge rider satisfaction with the program. The most recent survey was conducted in October 2022. This survey was conducted by Corey, Canapary, and Galanis, a local independent survey research company, and solicited feedback from more than 500 riders in a variety of languages, including Cantonese/Mandarin, Russian, and Spanish.
Some of the key findings for the SF Access program were:
- 91% and 88% of riders surveyed reported overall satisfaction with the SF Paratransit program, among both SF Access ambulatory and wheelchair riders.
- 92% and 95% overall satisfaction with their most recent trip among SF Access ambulatory and wheelchair users.
- 91% and 92% satisfaction with the courtesy of the driver among SF Access ambulatory and wheelchair users.
- 89% and 90% satisfaction with the driver’s skills operating the vehicle among SF Access ambulatory and wheelchair users.
- 88% and 90% satisfaction with the driver’s ability to assist with the rider’s disability among SF Access ambulatory and wheelchair users.
- 86% satisfaction with the reservation process.
- 91% satisfaction with the timeliness of the arrival of the vehicle.
- 85% and 95% satisfaction with the Paratransit Broker’s office among SF Access ambulatory and wheelchair users.
SF Paratransit Taxi: SF Paratransit conducts an annual customer satisfaction survey among Paratransit riders to gauge rider satisfaction with the program. The most recent survey was conducted in October 2022. This survey was conducted by Corey, Canapary, and Galanis, a local independent survey research company, with more than 500 riders in a variety of languages, including Cantonese/Mandarin, Russian and Spanish.
Among the key findings for the SF Paratransit taxi program include:
- 91% and 93% overall satisfaction with the SF Paratransit program among ambulatory taxi and ramp taxi riders.
- 90% and 97% overall satisfaction with their most recent trip among ambulatory taxi and ramp taxi riders.
- 88% and 100% satisfaction with the courtesy of the driver among ambulatory taxi and ramp taxi riders.
- 91% and 97% satisfaction with the driver’s skills operating the vehicle among ambulatory taxi and ramp taxi riders.
- 84% and 92% satisfaction with the driver’s ability to assist with the rider’s disability among ambulatory taxi and ramp taxi riders.
- 22% of ramp taxi riders called the driver directly to request a trip as opposed to only 5% of ambulatory taxi riders.
- 84% satisfaction with the timeliness of the arrival of the vehicle.
- 88% and 83% satisfaction with the Paratransit Broker’s office among ambulatory taxi and ramp taxi riders.
Group Van: SF Paratransit conducts an annual customer satisfaction survey among Paratransit riders to gauge rider satisfaction with the program. The most recent survey was conducted in October 2022. This survey was conducted by Corey, Canapary and Galanis, a local independent survey research company, with over 500 riders in a variety of languages, including Cantonese/Mandarin, Russian, and Spanish.
Key findings for the Group Van program are:
- 85% and 40% overall satisfaction with the SF Paratransit program among Group Van riders and agency coordinators.
- Low satisfaction from Group Van agency coordinators stem from issues pertaining to adding riders on existing or getting new routes created.
- 95% overall satisfaction with their most recent trip among Group Van riders.
- 100% satisfaction with the courtesy of the driver among SF Access ambulatory and wheelchair users.
- 95% satisfaction with the driver’s skills operating the vehicle among SF Access ambulatory and wheelchair users.
- 100% satisfaction with the driver’s ability to assist with the rider’s disability among SF Access ambulatory and wheelchair users.